Related to the FED increasing its balance sheet read Frances Coppola's "Banks Don't Lend Out Reserves" and pay attention to Lee Adler's comments as they add to the understanding rather then obfuscate and deflect as with most of the discourse on the web.
Webcast of this morning's press conference by Bank of Canada Governor Stephen S. Poloz and Senior Deputy Governor Tiff Macklem about the Monetary Policy Report.
Of note, at about 11 minutes Tiff Macklem responds to a question about a soft landing in the housing market.
At about 24 minutes Stephen Poloz is asked about how to moderate risk in the housing market (and by extension in the financial sector) given the reluctance to cut the policy rate.
And at about 27 minutes Stephen Poloz is questioned about the Canadian dollar dropping 10 cents in relation to the US dollar since his tenure began.
Susan Webber, now going by the pen name Yves Smith of Naked Capitalism and ECONed fame gives her views on banking with particular focus on the American money center banks and their investment banking operations on RT.com
To see what’s going on, we can exploit the savings-investment identity
Investment = Savings
Investment = Household Savings + Government Savings + Corporate Savings + Foreign Savings (the inverse of the current account)
Corporate Profits = (Investment – Foreign Savings) – Household Savings – Government Savings + Dividends
This basic decomposition, at least to an approximation allowed by national income accounting and modest statistical discrepancies, is shown below (h/t Jesse Livermore, Michal Kalecki).
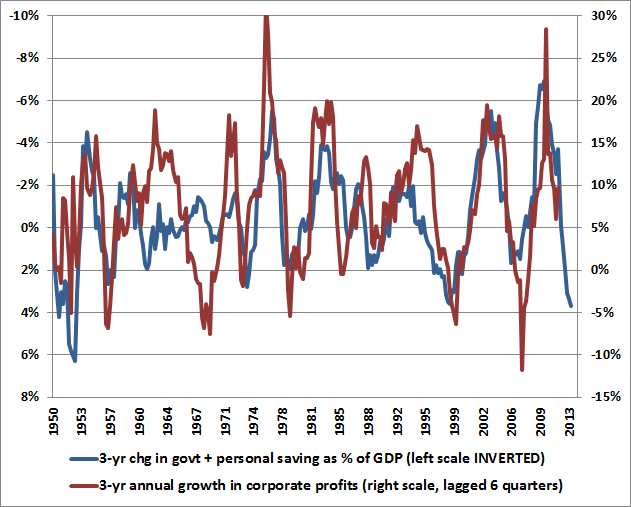
"Corporate profits as share of GDP nearly the mirror image of deficits in household and government sectors."
We can go further. The reason (Investment – Foreign Savings) are in parentheses above is because particularly in U.S. data, they have an inverse relationship, as “improvements” in the current account are generally associated with a deterioration in gross domestic investment. So the term in parentheses adds very little variability over the course of the business cycle. Likewise, dividends are fairly smooth, and add very little variability over the course of the business cycle.
As a result, the above identity reduces – from the standpoint of overall variability – to a statement that corporate profits as a share of GDP are nearly the mirror image of deficits in the household and government sectors. A simple way to think about this is that dissaving in both sectors helps to support corporate revenues and limit the need for competition, even when wages and salaries are depressed. It follows that most of the variability in corporate profits over time is driven by mirror image variations in the household and government sectors. As it happens, this relationship turns out to be strongest with a lag of roughly 4-6 quarters. Given the general improvement in combined government and household savings that began just over a year ago, it follows that current-year or even higher year-ahead earnings estimates may not be particularly useful “sufficient statistics” for the purpose of valuing equities.
A predictable response among investors is to immediately seek alternate explanations that might allow profit margins to remain permanently elevated. First among these is the argument that somehow the production of U.S. companies abroad is not being taken into account. But the difference between Gross National Product (which does exactly that) and Gross Domestic Product – even if it represented pure profit – is only about 1%. The adjustment might make a difference in Ireland, where the gap between GNP and GDP is far larger, but the effect is purely second-order in the United States. Moreover, any additional dynamic that prompts the claim “this time is different” had better be one that emerged in the past few years, because as the charts above demonstrate, the mirror-image relationship between variations in corporate profits and variations in combined government and household savings has hardly missed a beat in the past century.
There is a dynamic to capitalism that makes it enduring but it requires checks and balances between all sectors of the economy. If the corporate sector continues to flourish at the expense of the household sector there comes a point where the demand will either drop off or stagnate. Corporate cost cutting can only go so far, as can extension of credit to the household sector to bring forward consumption.
This dynamic was foreshadowed in 1987 by Paul Sweezy and Harry Magdoff but muffled by a media that believes a truly dissenting view to be career ending.
To a free market economist, the rise of Wall Street was a natural outgrowth of the U.S. economy's competitive advantage in the sector. Sweezy said it reflected an increasingly desperate effort to head off economic stagnation. With wages growing slowly, if at all, and with investment opportunities insufficient to soak up all the [actual and potential] profits that corporation were generating, the issuance of debt and the incessant creation of new objects of financial speculation were necessary to jeep spending growing. "Is the casino society a significant drag on economic growth?" Sweezy asked in a 1987 article he cowrote with Harry Magdoff. "Again, absolutely not. What growth the economy has experienced in recent years, apart from that attributable to an unprecedented peacetime military build-up, had been almost entirely due to the financial explosion." ~Wiliam Hinton, The Great Reversal (New York: Monthly Review Press, 1990), 168-71 (emphasis added)
Buoyant equity returns can continue but in 2015 they will climb the proverbial wall of worry.
Judging from this infographic at least. Note the number of icebreakers.
Naval Power
I bring this up because Diane Francis was making the rounds flogging her new book, Merger of the Century, exhorting Canada to merge with the United States in order to protect its economic interests. I have not read the book so will not comment on its contents but if Russia wanted to make inroads in the Arctic today, it would have a naval advantage given the number of icebreakers.
Markets are constantly in a state of
uncertainty and flux and money is [made] by discounting the obvious and betting
on the unexpected.~George Soros
Above is a good video featuring FT's John Authers warning about correlation, volatility and dispersion and how active management is not a panacea to markets correcting in 2014.
My small contribution centers on the notion of stock picking as a mitigation approach against potential market correction or rather my doubts about its efficacy.
The case for active management hasn't been bolstered by how active managers have perform during past corrections. Equity returns are the result of behavioural factors ("madness of crowds") and macro factors are increasingly important as global financial capital flows from one market to another searching for a return in a low yield stagnating world. In their intriguing book, The Era of Uncertainty- Global Investment Strategies for Inflation, Deflation, and the Middle Ground, FrancoisTrahan and Katherine Krantz point out:
71% of equity returns explained by macro trends
Investors often have a difficult time explaining the performance of their stock picks. This is largely because they underestimate the influence that macroeconomic forces have on individual stocks. They search for a connection between returns and earnings or management strength, but the truth is that an overwhelming majority of stock performance is explained by forces that go beyond the income and cash flow statements. In fact, the data show that historically 71 percent of equity returns are explained by macro trends.(Universe = SandP 100) This means that all of the time stock pickers spend poring over balance sheets and talking with company management accounts for less than one-third of a stock’s performance. How many investment managers would willingly admit that they are investing blindly with respect to two-thirds of the factors driving their portfolio’s return? (Trahan and Krantz, 2011:6)
Does their assertion mean that bottom up stock picking has no value (no pun intended)? No, it does not.
Since Ben Graham invented the idea of security analysis there have been a legion of true believers on what is the right way to pick equities with Buffet and Munger being the most famous exponents. There is value in understanding the fair value of an enterprise; value in considering the strength of management; and undoubtedly value in understanding the balance sheet and income statement as a means of ensuring that an investor has her return of capital before seeking a return on capital. But over and undervaluation is a fact of life generally and asset markets in particular. How many assets are ever at an equilibrium 'fair value'?
If people didn't have differences of opinion then markets would be wholly predictable. They aren't and Keynes's comment that “The market can stay irrational longer than you can stay solvent” remains true to this day. We can cling to an investing style but cannot ignore macro factors.
Returning to Trahan and Krantz (2011:37) macro framework:
In our experience, the strong relationship between leading economic indicators and stock price movements make them some of the most important indicators to track. It is no surprise that stocks and LEIs exhibit a tight correlation. LEIs are data series that tend to anticipate changes in economic activity several months in advance. Stocks tend to price in trends in economic growth about six month before they occur, making stocks themselves leading indicators.
LEIs refer to leading economic indicators. We need to ask ourselves the qualitative question: where are we in the business cycle?
Trahan and Krantz's Business Cycle Framework
Equity Returns through the Business Cycle
Trahan and Krantz make the case for Equity Returns tracking the Business Cycle
The Conference Board LEI: Looks positive
ITR's Leading Indicator: Not so positive
Looking at the annual returns for the S&P 500 (including dividends) we see the following:
2008: -37%; 2009: 26.46%; 2010: 15.06%; 2011: 2.11%; 2012: 16%; 2013: 32.39%
The post 2008 figures show that the markets have been on a very good bull run. Will that continue? No one can say with certainty that they will but unless the expansion phase of the business cycle is much longer this time around then previously one should err on the side of caution and conclude that we are in the late expansion phase rather then early expansion. (Note: the 9 year bull runs from 1991-1999 and the 8 year bull run from 1982-1989 may have made us think that buoyant markets are the norm but that does not take into account the liberalizing of capital markets, stripping away of the social contract and the demographic factor of workers in western economies generally).
There is no magic for corporate profitability despite the handsome compensation provided for corporate leaders, either there is: (i) pricing power; (ii) companies can financially engineer and lever up or; (iii) they can find efficiency by increasing productivity and reducing costs. It isn't just a supply side story about lowering taxes and making markets business friendly.
This blog has argued consistently that the demand driven element cannot be overlooked and is arguably the real reason behind large corporations reluctance for capex and hiring expansion at home in domestic markets. Stock markets have gone up despite a sluggish growth picture in advanced economies which entails that they have been masters of increasing efficiencies and decreasing costs.
Just how long they can collectively continue to go to the well will determine the legs left in this bull market and the outlook for returns in 2014 and 2015.
References
Trahan, Francois, and Katherine Krantz. The Era of Uncertainty- Global Investment Strategies for Inflation, Deflation, and the Middle Ground. Hoboken, New Jersey.: John Wiley & Sons, Inc., 2011.
CLSA strategist Russel Napier made the rounds in late November and early December 2013 with his pitch that deflation is in our future. I sympathize with many tenets of Napier's analysis (overcapacity, stock market valuation, emerging market debt issues, bank credit contraction) but disagree with his final conclusion -- a 70% correction in the S&P 500 -- given the fact that central banks are 'all-in' in terms of reflationary policies such as quantitative easing to prop up asset prices. A baseline scenario for me is continued stagnation given the dearth of effective demand. The most healthy dynamic in a market economy requires countervailing power from competing sectors however at present the aggregate power of labour (and by extension households) has been in steady decline for a generation and the waning of credit extension augers poorly for future growth prospects in advanced economies.